Only nine Brazilian states monitor air quality
This is one of the information revealed by the new Air Quality Platform, launched by the Energy and Environment Institute

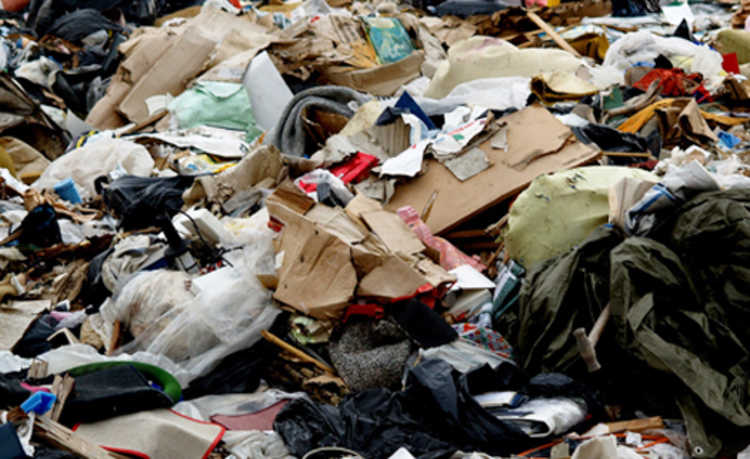
Resized image by Davidson Luna, is available on Unsplash
Of the 27 states in Brazil, only nine carry out air quality monitoring. They are Bahia, Espírito Santo, Minas Gerais, São Paulo, Rio de Janeiro, Rio Grande do Sul, Paraná, Goiás and the Federal District. Although the state with the best monitoring coverage is São Paulo, in general, network coverage is insufficient in the country, being more critical in the Northeast and Midwest regions; and in the North, where there is no monitoring. Currently, seven pollutants are regulated in Brazil for their recognized damage to health: total suspended particulates (PTS), inhalable particulates (MP10), smoke, sulfur dioxide (SO2), nitrogen dioxide (NO2), carbon monoxide (CO) and ozone (O3). Since fine particulate matter (PM2.5) and ozone are the pollutants whose concentration control is more challenging. These pollutants are poorly monitored, despite their health impacts, PM2.5 is monitored in only four states and ozone in seven.
These and other data on air pollution in Brazil are compiled in the new version of the National Air Quality Platform (//qualidadedoar.org.br/) developed and launched on November 14 by the Energy and Environment Institute (// www.energiaeambiente.org.br/), a non-profit organization that produces technical data to influence public policy. The online tool is the only one in the country to gather data on the concentration of pollutants and indicate the exceedances of national standards and the recommendations of the World Health Organization (WHO), which can help specialists and managers in assessing the effects of air pollution in health.
“The low coverage of monitoring stations means that in most parts of the country the population does not know what air they are breathing,” says meteorologist Beatriz Oyama, air quality analyst at IEMA. "The monitoring of air quality is an important tool for public management." With proper monitoring in cities, it is possible to know when the air is inadequate and take measures to reduce pollutant emissions, such as restricting some industrial activities and the use of cars and encouraging the use of public transport. At the limit, it is possible to recommend that citizens and health professionals be more alert on the most critical days.
Monitoring can help identify polluting sources, such as specific industries or locations with heavy vehicular traffic, and take action to reduce these emissions. Measuring air quality is also one of the relevant instruments to verify the effectiveness of the vehicle control program (Proconve), which regulates engine technology and fuel quality. It is also necessary information for the government to authorize the installation of new industries in areas that are sensitive to the health of the population.
Reference for the WHO since 2016, the new version of the IEMA Platform provides detailed information on the distribution of monitoring stations and on variations in the concentrations of monitored pollutants. It is also more interactive and practical to consult, but the biggest news is the concentration data by time of day. They allow us to know, for example, which are the times of day with peaks of a specific type of pollutant, the months of the year in which the highest concentrations are observed.
Since each state has its own methodology to calculate pollutant concentrations, after studying these different adopted methodologies, the IEMA platform used the method used by most states to standardize the calculations making data from different states comparable.
Among the pollutants currently measured in Brazil, the only ones that do not show a clear downward trend are fine particulate matter and ozone. Thus, these are the pollutants that are of greatest concern, as they represent high health risks when in high concentrations.
The finest particulate matter (PM2.5) is one of the most responsible for respiratory and cardiovascular diseases in the world. It is emitted by burning fuels in industries and vehicles, this second source becomes even more relevant in more urbanized centers. It is also formed in the atmosphere from chemical reactions with other gases and pollutants. Although PM2.5 has its damage to health scientifically proven, only four states monitor this pollutant: Minas Gerais, Rio de Janeiro, São Paulo, and Espírito Santo, and only in these last two PM2.5 is regulated. On the Air Quality Platform, it is possible to see how the concentration of particulate matter has evolved in various parts of the country. At the station in the neighborhood of Cerqueira César, in the Avenida Paulista region of the city of São Paulo, the average annual concentration of particulate matter dropped from 24 to 16 micrograms per cubic meter between 2000 and 2009. Afterwards, it began to oscillate without apparent drop. Always above the concentration of 10 micrograms per cubic meter recommended by the WHO.
Ozone is another pollutant that has presented concentrations well above the values recommended by the WHO. Those who are exposed to it regularly are at risk of developing asthma and other cardiovascular diseases and having their lung capacity reduced. As it is not directly emitted by any pollutant source, ozone control is a great challenge. It is formed during the day, from the reaction between pollutants originating from incomplete burning processes (fuels, burning). The Air Quality Platform also allows you to check ozone concentrations in various cities. The average maximum of 8 hours of ozone, in Ibirapuera Park in São Paulo, ranged between about 200 and 160 micrograms per cubic meter between 2013 and 2016. That is, even above the WHO recommendations, of 100 micrograms per cubic meter.
The platform shows how the most critical pollutants today are PM2.5 and O3, in addition to the other regulated pollutants. On the other hand, the good news for the platform is that other pollutants show a drop. This is the case of particulate matter (PM10), sulfur dioxide (SO2), carbon monoxide (CO) and nitrogen dioxide (NO2). All these pollutants have shown a tendency to reduce concentrations over the years and, in most stations, have met the WHO recommendations.
Link to the IEMA Air Quality Platform: qualdoar.org.br